
Bitcoin and Short-Term Trading: How to Use Open Interest and Volatility for UP/DOWN Predictions
Short-Term Bitcoin Trading: UP and DOWN Options
In recent weeks, Bitcoin has demonstrated significant volatility, attracting the attention of binary options traders.
For short-term trades like UP and DOWN options, key factors such as price fluctuations and open interest in futures markets are crucial.
Understanding these factors allows traders to make more informed decisions. In this article, we’ll discuss how the current Bitcoin market situation can affect short-term trades and how to effectively use key data points.
Current Situation with Bitcoin
At the time of writing, Bitcoin is trading around $112,000, testing the important middle Bollinger Band on the weekly chart.
This indicator often serves as dynamic support. If the price drops below $112,000, it could signal the start of a correction, providing an opportunity for a DOWN option.
However, if the price holds at this level and continues upward, it would suggest a continuation of the bullish trend, opening opportunities for an UP option.
- Support levels: $112,000 and $110,000
- Resistance levels: $115,000 and $117,000
These key levels act as benchmarks for determining the potential for both upward and downward price movements in the short term.
The Impact of Open Interest on the Market
Open interest in Bitcoin futures contracts represents the number of open positions that have not been closed. Rising open interest usually signals a high level of market activity and can predict the continuation of the trend.
When open interest increases alongside rising prices, it confirms the bullish trend, making UP options more attractive.
- If open interest rises while the price increases, it confirms the bullish trend, signaling a favorable time to purchase a UP option.
- A decline in open interest during a price drop may indicate trend weakness and a potential reversal, opening up opportunities for a DOWN trade.
Key Levels for UP/DOWN Trading
For successful UP/DOWN binary options trades, it’s essential to track the following key levels:
- Support at $112,000 and $110,000: If Bitcoin breaks below these levels, it signals a DOWN option trade (for a price decline).
- Resistance at $115,000 and $117,000: If these levels are breached upward, it opens the possibility for an UP option trade (for a price increase).
Trade Recommendations
- Consider DOWN options (for a price decrease) if the price breaks below $112,000.
- UP options (for a price increase) are a good opportunity if the price remains above $112,000 and heads toward $115,000 or higher.
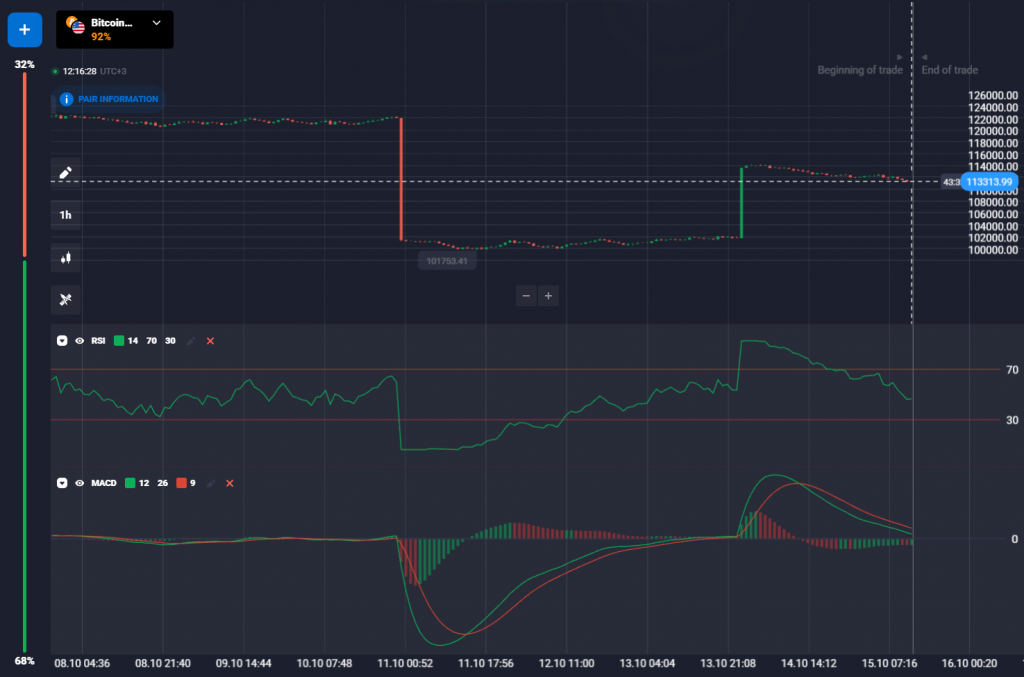
Technical Indicators for UP/DOWN Trades
Technical indicators help predict short-term price movements, which are crucial when deciding on UP and DOWN trades.
- RSI and the stochastic oscillator are in neutral territory but show a downward trend, indicating weakening buying pressure. This could be a signal for DOWN trades.
- MACD remains below the zero line, confirming the downtrend and potentially signaling a DOWN trade.
For binary options traders, this suggests that with the current dynamics, a price correction and decline are likely, making DOWN options more favorable.
Macroeconomic Factors and Their Impact on Short-Term Trading
In addition to technical analysis, it’s important to consider macroeconomic factors that could affect Bitcoin’s price:
- The Federal Reserve (Fed): Speeches from key figures such as Jerome Powell influence cryptocurrency markets. A dovish monetary policy could lead to growth in risk assets, including cryptocurrencies.
- Global Economic Instability: Trade wars, such as conflicts between the U.S. and China, can cause sharp price fluctuations. Increased market volatility offers opportunities for short-term UP/DOWN trades.
Conclusions for Short-Term Traders
- Key levels for UP/DOWN trades:
- Support at $112,000 and $110,000: Breaking these levels downward will open up the opportunity to buy a DOWN option.
- Resistance at $115,000 and $117,000: Breaching these levels upward signals a time to buy a UP option.
- Open interest: Rising open interest during a bullish trend confirms potential price growth, favoring UP trades. A decline during a price drop can signal a reversal, opening opportunities for DOWN trades.
- Technical indicators (RSI, MACD, stochastic) show weakening buying pressure, suggesting a continuation of the downtrend and opening opportunities for DOWN trades.
Summary: How to Use Data for Short-Term UP/DOWN Trades
- Support at $112,000 and $110,000: Key levels for determining potential DOWN trades.
- Resistance at $115,000 and $117,000: Levels that open opportunities for UP trades.
- Use technical indicators (MACD, RSI) for more accurate predictions.
This approach will help short-term traders in binary options make informed decisions based on current market conditions, using support and resistance levels, open interest, and technical indicators for UP and DOWN trades.
With these insights, traders can leverage short-term volatility for profitable binary options trades. Keep monitoring key levels and market indicators to maximize potential gains!